Dow Jones Industrial Average Jones Industrial Average Time Series Analysis
Introduction
Our Financial Consultant firm was task by our client with the following request. We are to analyze the DJIA index stock and make a recommendation to advise our client to buy or sell this stock. Our approach was to analyze the stock and explain the Long-Term and Short-Term Trend alone with an explanation of the Moving Averages. We are to support our decision with the following Technical Analysis methods Charting, Filtering and Crossover methods.
Methodology
Explain LTM
Long-term Graph
We started by down loading the historical data of the DJIA from 1/3/2017 to 11/15/2019 for the Long-Term Trend. The following is a graph of our findings.
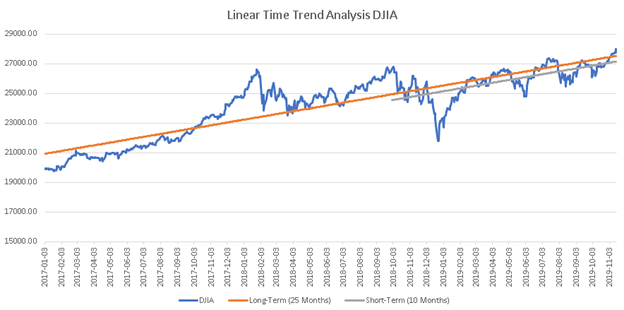
The blue line is the actual price point at specific points in times. We see in uptrend line in the DJIA with a positive slope which connects two or more data points. Each low is higher than before. Regarding the Long-term, starting on January 3, 2017, the Dow was at 19,882 points. To the current date, November 15, 2019, the dow rose to 28,005 points. That’s a 8,123 point increase in 2 years and 11.5 months.
Long-term Trend
- December 26, 2018 – the Dow Jones Industrial Average jumped up 1,086 points from 21,792 points to 22,878 points. Rallies in retail and energy shares led the gains. At the end of the day the stock closed at 4.98 percent higher. This event happened one day after Christmas. (https://www.cnbc.com/2018/12/26/us-futures-following-christmas-eve-plunge.html).
- January 4, 2019 – the Dow Jones Industrial Average jumped up 747 points from 22,686 points to 23,433 points. Some of the gain was due to a Robust Job market and investors felt optimistic about the economy. Also, the Federal reserve said it will be flexible in its plan to hike the interest rates, this also added to the optimistic for investors. Another reason the Dow jumped, was China slashed the amount of money banks are required to hold in their reserves to stimulate their economy. Riskier stocks led the rally, including tech companies like Facebook, Apple Amazon Netflix and Google (https://www.cnn.com/2019/01/04/investing/Dow Jones Industrial Average-stock-market-today/index.html).
- February 5, 2018 – the Dow Jones Industrial Average dropped 1,175 points from 25,520 points to 24,345 points. Nothing fundamentally was happening with the economy at the time which made it hard to understand why the Dow dropped. However, we did just state a new Feb chairman Jerome Powell. Some of the selloff was due to fears of a rise an inflation and fears of a rise the interest rate. Also, Bonds yields rose giving better returns then stocks ( https://money.cnn.com/2018/02/05/investing/stock-market-today-Dow Jones Industrial Average-jones/index.html).
- February 8,2018 – the Dow Jones Industrial Average dropped 1,032 points from 24,893 points to 23,860 points. Some of the reasons the dow dropped so many points was fears about the bond market, rise an inflation and rise in the interest rates. Investors also worried that the Treasury Bills yields will rise to levels that will make stocks less attractive and will force the Federal Reserve to fight inflation by aggressively raising interest rates.(https://money.cnn.com/2018/02/08/investing/Dow Jones Industrial Average-jones-stock-market/index.html)
Short-Term Graph
When looking at the blue line, we see in uptrend line in the DJIA with a positive slope which connects two or more data points. Regarding the Short-term, starting on October 1, 2018, the Dow Jones Average was at 24,941 points. More recently, November 15, 2019, the Dow Jones Average rose to 28,005 points. That’s a 3,064-point increase in 10 months.
Short-term Trend
- January 4, 2019 – the Dow Jones Industrial Average jumped 747 points from 22,686 points to 23,433 points. This was propelled by Powell’s comments and an outstanding jobs report. Another reason for investors’ confidence was the Federal Chairman, Jerome Powell’s said the central bank will be patient in raising interest rates. Also, the U.S. economy added 312,000 jobs in December which was 176,000 more than expected. We also had gains in the tech industry with boost in Netflix, Apple, Amazon and Intel,( https://www.cnbc.com/2019/01/04/stock-market-investors-react-to-us-china-trade-talks.html).
- November 28, 2018 – the Dow Jones Industrial Average jumped 617 points from 24,748 points to 25,366 points. Some of the reason was due to the Fed Chairman statement about interest rates being naturalized. Also, bank stocks climbed as short-term borrowing rates fell and long-term rates rose following Powell’s remarks. The spike was led by the Morgan Stanley, Goldman Sachs and Bank of America. Trump and Chinese President Xi Jinping are schedule to meet and talk about trade ( https://www.cnbc.com/2018/11/28/stock-market-wall-street-looks-to-fed-chair-speech-and-trade-news.html).
- October 10, 2018 – the Dow Jones Industrial Average dropped 831 points from 26,430 points to 25,598 points. The tech sector leads the drop. Also, Global slowing and Treasury bills yield on the rise. Decrease in stock like Netflix, Facebbok and Apple ( https://www.cnbc.com/2018/10/10/us-markets-bond-yields-and-data-in-focus.html).
- August 13, 2019 – the Dow Jones Industrial Average dropped 800 points 26,279 points to 25,479 points. Bond market send recession warning. Bank stocks also led the declines hard from banks to make a profit lending money. The banks stocks fall Bank of America, Citigroup, and J.P. Morgan. Recession normally happens 22 months after the inversion of the bond yield. Germany’s, Europe and china could be facing a recession. (https://www.cnbc.com/2019/08/14/stock-markets-wall-street-in-focus-amid-earnings-economic-data.html)
Long-Term Regression Analysis
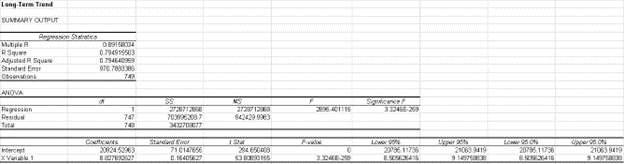
When we look at the Long-term Regression Analysis, we see a good “R Square of 0.79” which means the closer to 1 is means a strong relationship between the Y axis (dollars) and X axis (time). Which means 79% of the data points fall on the regression line. A R Square of less than .70 indicate a weak correlation between the Y axis and X axis. In our regression analysis our equation is the following Y = 20924.52963 + 8.827692627 * (Time). Again, we used an “Observations” of 749 days (1-3-2017 to 11-15-2019).
Hypothesis Test Results
H₀: β₁ = 0
H₁: β₁ ≠ 0
Because the P-value is 3.3246 > α .05 (1.96) accept H₀ and reject H₁. This means that β₁ₓ drops out of the equation and X is not an important determinant of Y.
Short-term Regression Analysis
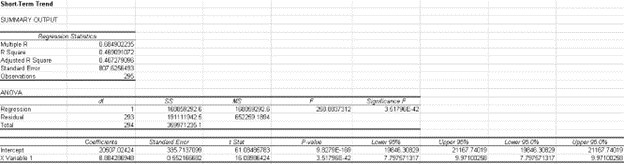
When we look at the Short-term Regression Analysis, we see a not so good “R Square of 0.46” which means there’s a weak relationship between the Y axis (dollars) and X axis (time). This means 46% of the data points fall away from the regression line. A R Square of less than .70 indicate a weak correlation between the Y axis and X axis. In our regression analysis our equation is the following Y = 20924.52963 + 8.827692627 * (Time). This can be interpreted by staying the DJIA increase about $8.82 per day. Again, we used an “Observations” of 295 days (10-1-2018 to 11-15-2019).
Hypothesis Test Results
H₀: β₁ = 0
H₁: β₁ ≠ 0
Because the P-value is 3.5179 > α .05 (1.96) accept H₀ and reject H₁. This means that β₁ₓ drops out of the equation and X is not an important determinant of Y.
Explain MA Methods
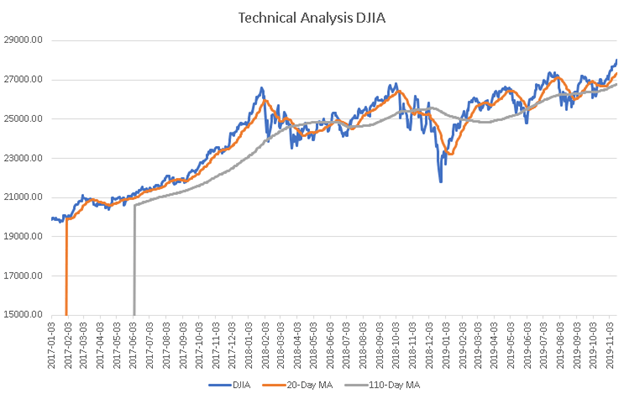
When we completed our Technical Analysis DJIA graph we had to look at the Moving Averages for 20 days and 110 days. When our graph was completed here’s what it looked like.
Charting Method
The Charting Method is based on the Local Peaks and Local Troughs. In a Dow Jones Industrial Average trend, we connect 2 or more peaks and this line called is the resistance. When we have an uptrend connected by 2 or more local troughs, we sell. From our data we have to local troughs in the short-term on 08-14-2019 and 10-04-2019. This is trend line the is called the Support line and we recommend our client sell their stock.
Filter Method
The Filter Method is a trading strategy which traders set rules for when to buy and sell investments based on percentage of changes from prior prices. Certain percentages rise triggers a buy and certain percentage fall triggers a sell. With our recommendation when using the Filter Method, we recommend buying or selling the stock when the stock falls below from .05% to 3% or rise above .05% to 3%. On 11-14-2019 the stock was priced at $27,781.96 and on the next day the stock priced closed at $28,004.89 which is calculated at a 0.80% rise, so we recommend selling the stock (($28,004.89 – 27,781.96 = 222.93) (222.93/28,004.89= 0.80%)).
Crossover Method
The Crossover Method is a lagging indicator. When compared to the cross over method, we should sell the stock. The cross over method states that when the 20 Day MA cross over the 110 Day from the bottom this is an indicator to sell. When the 20 Day MA cross over the 110 Day from the top this is an indicator that we should buy.
Findings
Conclusion/Recommendation

Leave a comment